The Findings list
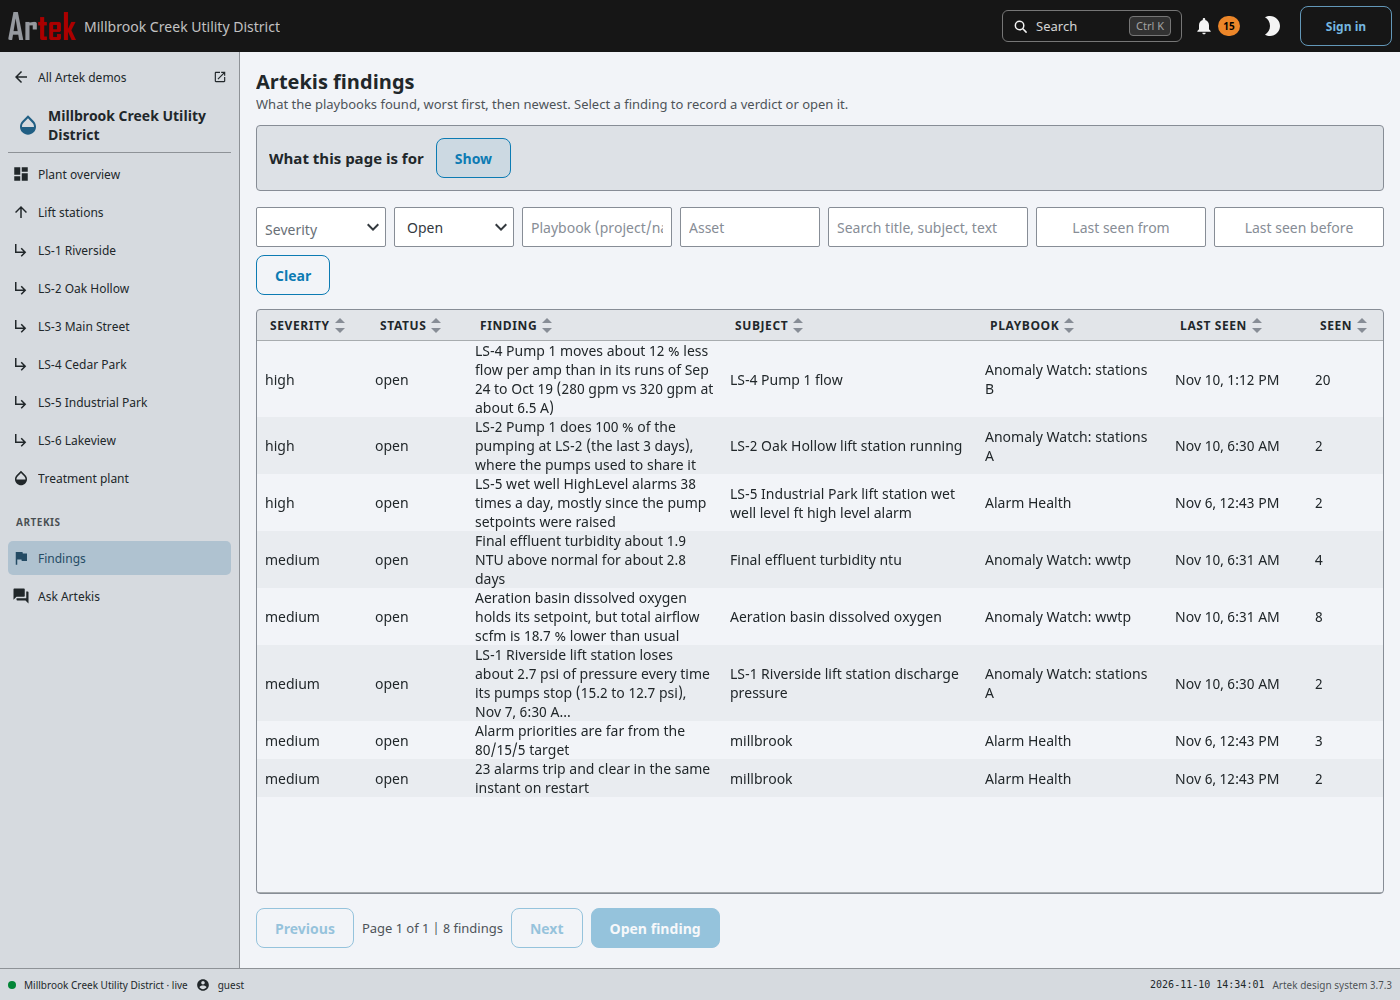
The Findings page is where you start. It lists every problem Artekis has found that is still worth your attention.
How it is ordered
Findings are listed worst first, then newest. Severity is always written out as a word (high, medium, low), never shown by color alone.
One cause seen on several machines is one row, for example "(on 3 assets: ...)". A saved alarm rule that has fired many times is also one row ("Detector fired 23 times..."), so the list does not fill up with repeats.
The columns
| Column | What it tells you |
|---|---|
| Severity | How much this needs attention. |
| Status | open while the problem is still there. Artekis marks a finding resolved on its own when the readings return to normal. |
| Finding | The one-line summary. |
| Subject | The machine or reading it is about, named the way your plant names it. |
| Playbook | Which Artekis check found it, such as Anomaly Watch or Alarm Health. |
| Last seen | When a check last confirmed it was still there. |
| Seen | How many checks have found it. A number that keeps climbing means the problem keeps showing up. |
| Cost | Shown when your plant has costs set up. What the finding costs, and what kind of figure it is: money it caused ("USD 719 attributed"), money above normal running ("USD 9,005 above normal"), time left before a limit, or "Not priced" with the reason. Different kinds are never added together, so the list is not sorted by cost. |
Select a row to record your answer on it, or press Open finding to read it.
Filtering
Narrow the list by severity, status, playbook, machine (asset), text and dates. The list opens showing Open findings. On a phone the filters sit behind a Filters button and the table shows only Severity and Finding.
Next
Open a finding to see its proof: Reading a finding.